Free Access
Fig. 16
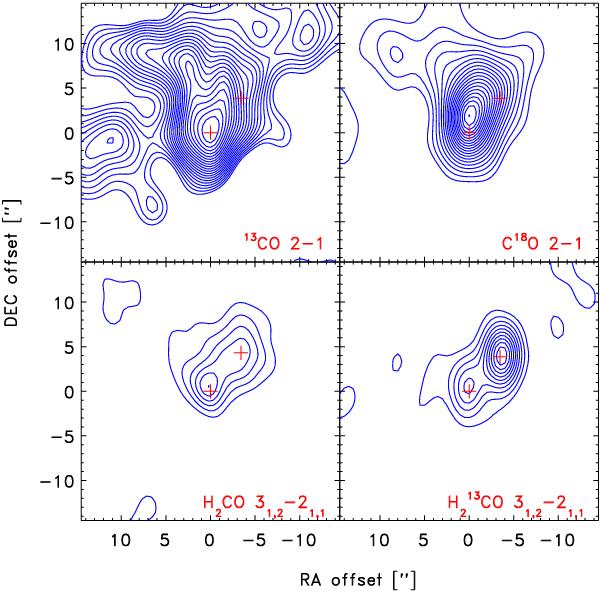
Comparison between 13CO 2–1 (upper left), C18O 2–1 (upper right), H2CO 31,2 − 21,1 (lower left) and H CO 31,2 − 21,1 (lower right). For all species the emission is integrated from 1 to 5 km s-1. The contours are shown in steps of 9 Jy beam-1 km s-1 for the CO isotopologues and 3 Jy beam-1 km s-1 for the H2CO isotopologues.
Current usage metrics show cumulative count of Article Views (full-text article views including HTML views, PDF and ePub downloads, according to the available data) and Abstracts Views on Vision4Press platform.
Data correspond to usage on the plateform after 2015. The current usage metrics is available 48-96 hours after online publication and is updated daily on week days.
Initial download of the metrics may take a while.