Fig. 11
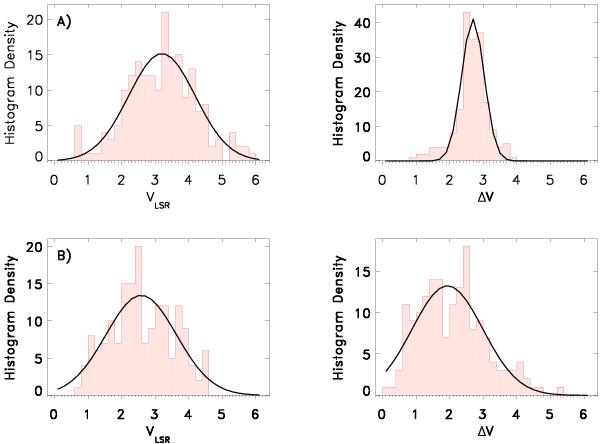
Distribution of centroid velocities and widths (dispersions) in the left and right panels, respectively for emission lines detected toward the A source (upper panels) and B source (lower panels). Gaussian fits to the distributions are over-plotted (VLSR of 3.2 and 2.7 km s-1 and ΔV of 2.6 and 1.9 for A and B respectively). The VLSR and ΔV distributions for the two sources are significantly different according to a standard T test for distributions with unequal variances.
Current usage metrics show cumulative count of Article Views (full-text article views including HTML views, PDF and ePub downloads, according to the available data) and Abstracts Views on Vision4Press platform.
Data correspond to usage on the plateform after 2015. The current usage metrics is available 48-96 hours after online publication and is updated daily on week days.
Initial download of the metrics may take a while.