Fig. 1
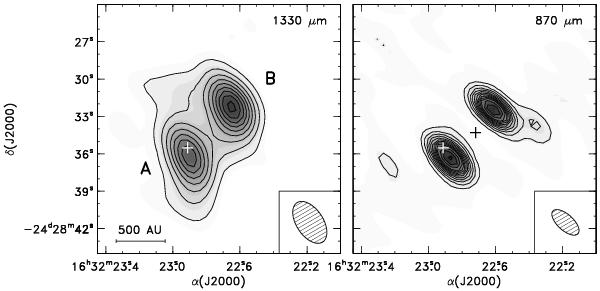
Continuum images of IRAS 16293-2422 at 1.3 mm (left) and 0.87 mm (right). In the left panel the contours are given in steps of 0.1 Jy beam-1 to 1.0 Jy beam-1 and from there in steps of 0.2 Jy beam-1 and in the right in steps of 0.2 Jy beam-1 to 2.0 Jy beam-1 and from there in steps of 0.4 Jy beam-1 (in the continuum data the noise level is determined by the interferometer dynamic range). The white plus-signs indicate the pointing centers of the observations, except those from 2007 March 22 for which the pointing center is indicated by the black plus-sign in the right panel.
Current usage metrics show cumulative count of Article Views (full-text article views including HTML views, PDF and ePub downloads, according to the available data) and Abstracts Views on Vision4Press platform.
Data correspond to usage on the plateform after 2015. The current usage metrics is available 48-96 hours after online publication and is updated daily on week days.
Initial download of the metrics may take a while.