Fig. 9
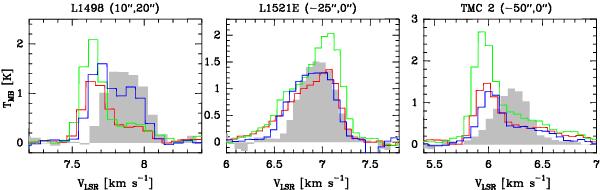
Superposition of the three hyperfine components of HCN(1−0) (F = 1 → 1, red line; F = 2 → 1, green line; F = 0 → 1, blue line) with the strongest component (F = 2 → 1, gray histograms) of H13CN(1−0) [× 4], see Table B.1 for component indices. In order to compare line shapes and intensities, components have been shifted in frequency.
Current usage metrics show cumulative count of Article Views (full-text article views including HTML views, PDF and ePub downloads, according to the available data) and Abstracts Views on Vision4Press platform.
Data correspond to usage on the plateform after 2015. The current usage metrics is available 48-96 hours after online publication and is updated daily on week days.
Initial download of the metrics may take a while.