Fig. A.1
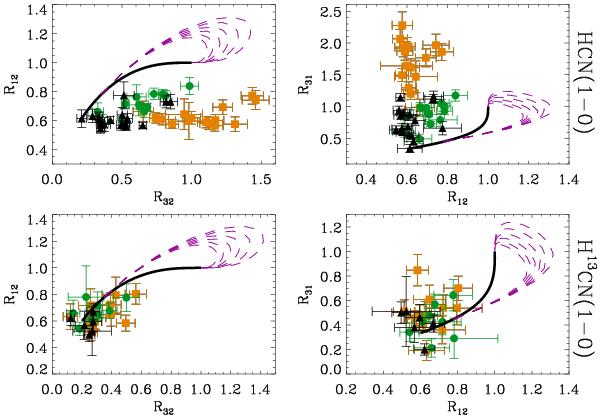
Ratio of the integrated intensities of couples of components of HCN(1−0) (upper panels), and H13CN(1−0) (lower panels), where Rij represents the ratio between the integrated intensities Wi and Wj (see Table B.1 for component indices). Observational data: L1498 (yellow squares), L1521E (green circles), and TMC 2 (black triangles). One-layer model (black solid curve), two-layer model (magenta dashed curves).
Current usage metrics show cumulative count of Article Views (full-text article views including HTML views, PDF and ePub downloads, according to the available data) and Abstracts Views on Vision4Press platform.
Data correspond to usage on the plateform after 2015. The current usage metrics is available 48-96 hours after online publication and is updated daily on week days.
Initial download of the metrics may take a while.