Free Access
Fig. 9
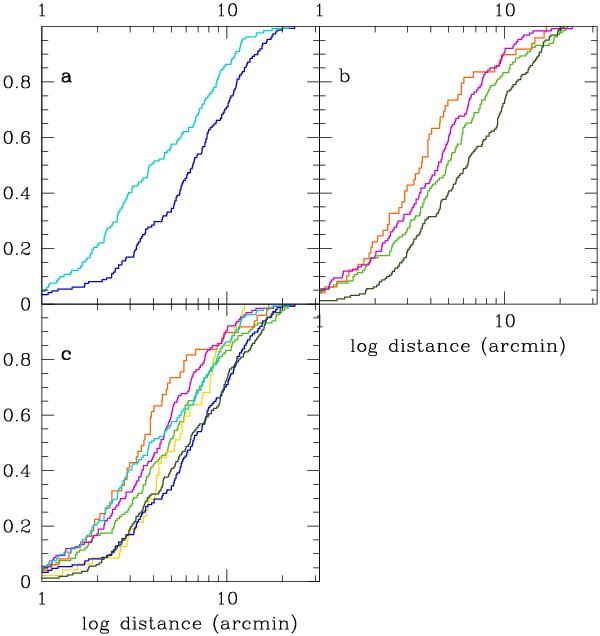
Cumulative fraction versus log distance plots. Different colours are for stars of the different groups (see Fig. 1). Panel a): metal-poor groups only (#4 and #6); panel b): metal-intermediate groups only (#1, #2a, #3, and #5); panel c): all groups. Different colours are for stars of the different groups.
Current usage metrics show cumulative count of Article Views (full-text article views including HTML views, PDF and ePub downloads, according to the available data) and Abstracts Views on Vision4Press platform.
Data correspond to usage on the plateform after 2015. The current usage metrics is available 48-96 hours after online publication and is updated daily on week days.
Initial download of the metrics may take a while.