Fig. 4
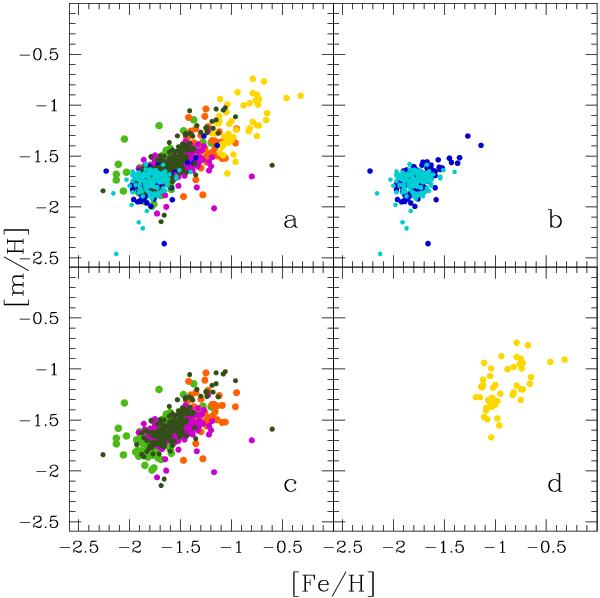
Comparison between iron abundances from spectroscopy [Fe/H] and metal abundances derived from colours along the RGB ([m/H]). Different colours are for stars of the different groups (see Fig. 1). Results for all stars are plotted in panel a); panel b) is is only for metal-poor stars; panel c) is only for metal-intermediate stars; and panel d) is only for metal-rich stars.
Current usage metrics show cumulative count of Article Views (full-text article views including HTML views, PDF and ePub downloads, according to the available data) and Abstracts Views on Vision4Press platform.
Data correspond to usage on the plateform after 2015. The current usage metrics is available 48-96 hours after online publication and is updated daily on week days.
Initial download of the metrics may take a while.