Fig. 8
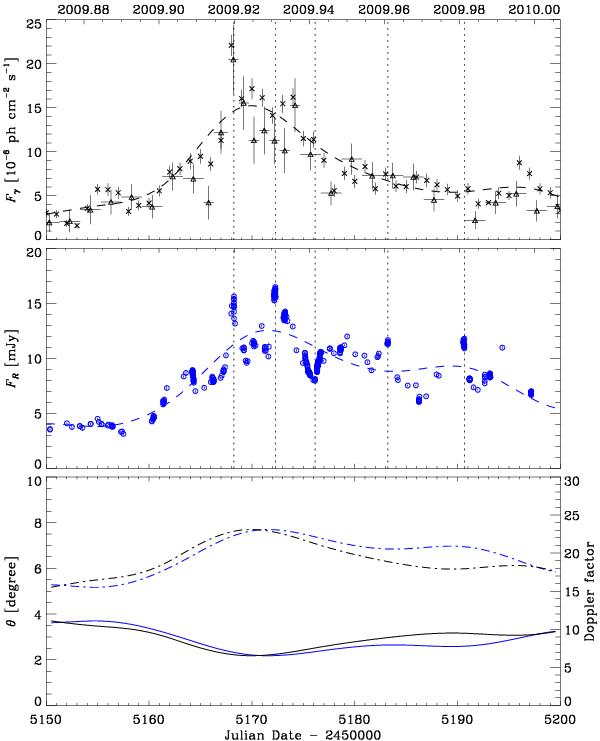
Flux variations of 3C 454.3 at γ-ray (top) and optical (middle) frequencies in late 2009. The γ-ray light curve is built with Fermi data (crosses) from Ackermann et al. (2010) and AGILE data (triangles) from Pacciani et al. (2010). Vertical dotted lines indicate remarkable optical events. Cubic spline interpolations through the 7-day binned optical (blue dashed line) and γ (black dashed line) light curves are also shown. They represent the variations due to geometrical changes. The evolution of the Doppler factor δ (dot-dashed lines) and viewing angle θ (solid lines) is shown in the bottom panel for both the γ-ray (black) and optical (blue) bands.
Current usage metrics show cumulative count of Article Views (full-text article views including HTML views, PDF and ePub downloads, according to the available data) and Abstracts Views on Vision4Press platform.
Data correspond to usage on the plateform after 2015. The current usage metrics is available 48-96 hours after online publication and is updated daily on week days.
Initial download of the metrics may take a while.