Fig. 5
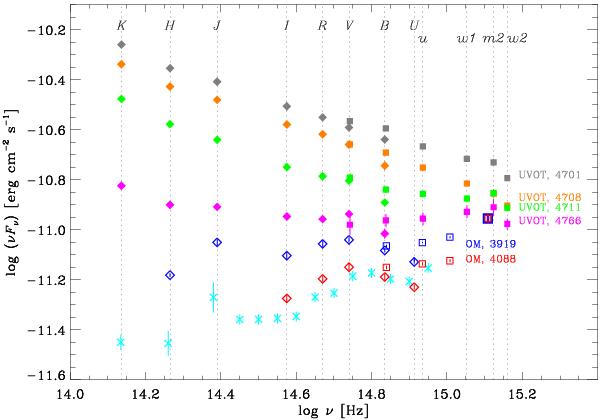
SEDs of 3C 454.3 from the near-IR to the UV band at different brightness levels. The four SEDs plotted with filled symbols correspond to epochs of Swift observations: recalibrated UVOT data are displayed with squares, simultaneous optical and near-IR data from the GASP-WEBT with diamonds. The two SEDs shown with empty symbols correspond to the two XMM-Newton observations of July (blue) and December (red) 2006 (see Raiteri et al. 2007): recalibrated OM data are plotted with squares and WEBT data with diamonds. The epochs of satellite observations (JD − 2 450 000) are indicated on the right. Error bars only take measure errors into account. Cyan crosses represent observations by Neugebauer et al. (1979).
Current usage metrics show cumulative count of Article Views (full-text article views including HTML views, PDF and ePub downloads, according to the available data) and Abstracts Views on Vision4Press platform.
Data correspond to usage on the plateform after 2015. The current usage metrics is available 48-96 hours after online publication and is updated daily on week days.
Initial download of the metrics may take a while.