Fig. 4
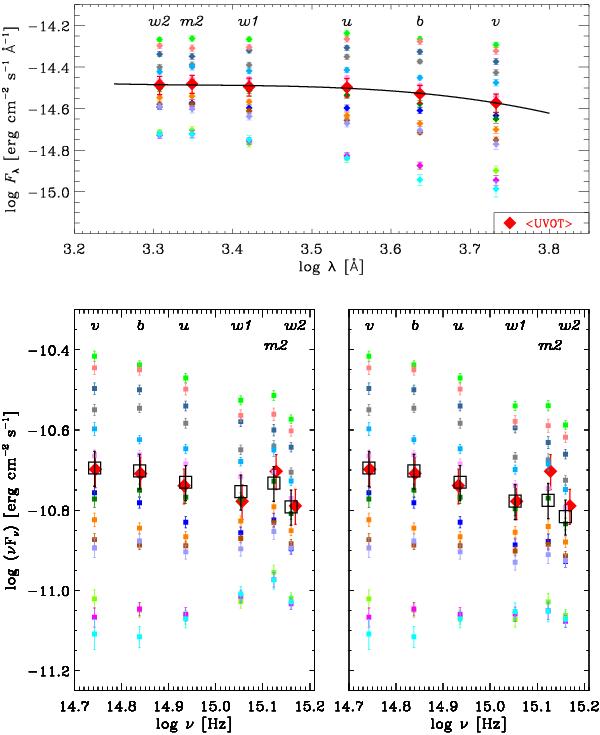
Top: observed spectra of 3C 454.3 in the optical-UV band obtained from different epochs of UVOT observations analysed in this paper. Red diamonds refer to the mean UVOT observed spectrum. The solid line is the log-cubic fit used in the calibration procedure. Bottom-left: optical-UV SEDs of 3C 454.3 corresponding to the observed spectra shown in the top panel. Red diamonds are derived from the UVOT average spectra shown in the top panel by using standard prescriptions to obtain de-reddened flux densities. Black squares represent the mean UVOT SED after recalibration as explained in the text. Bottom-right: the same SEDs shown on the left, after correction for the emission lines contribution.
Current usage metrics show cumulative count of Article Views (full-text article views including HTML views, PDF and ePub downloads, according to the available data) and Abstracts Views on Vision4Press platform.
Data correspond to usage on the plateform after 2015. The current usage metrics is available 48-96 hours after online publication and is updated daily on week days.
Initial download of the metrics may take a while.