Fig. 2
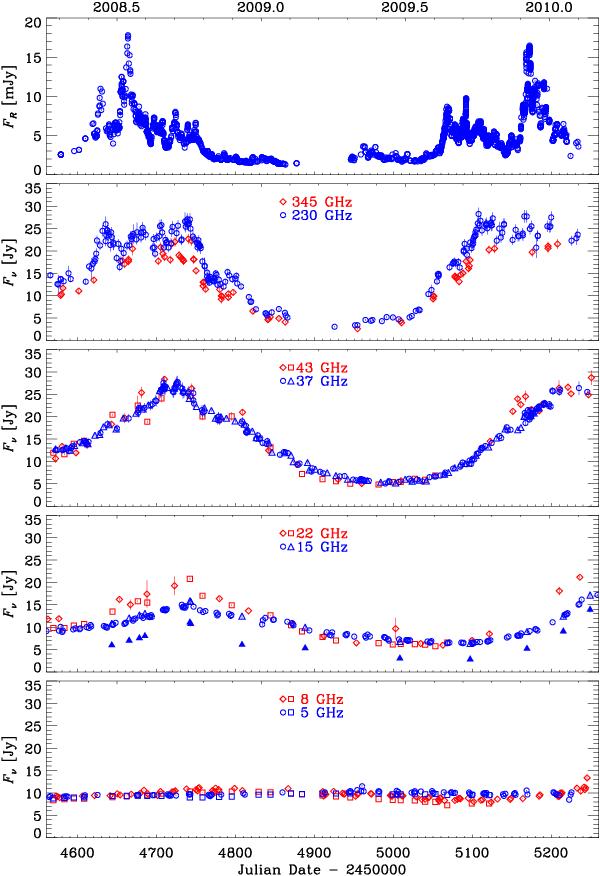
R-band optical flux densities in 2008–2010 (top) compared to the radio light curves at different frequencies. The GASP data (blue circles and red diamonds) are complemented with those from the Crimean Observatory at 37 GHz (blue triangles) and with those from the VLA/VLBA Polarization Calibration Database at 43, 22, 8 GHz (red squares), and at 5 GHz (blue squares). Data at 15 GHz from the MOJAVE Program are also included as blue triangles: the filled ones represent the core flux, and the empty ones the total flux.
Current usage metrics show cumulative count of Article Views (full-text article views including HTML views, PDF and ePub downloads, according to the available data) and Abstracts Views on Vision4Press platform.
Data correspond to usage on the plateform after 2015. The current usage metrics is available 48-96 hours after online publication and is updated daily on week days.
Initial download of the metrics may take a while.