Fig. 9
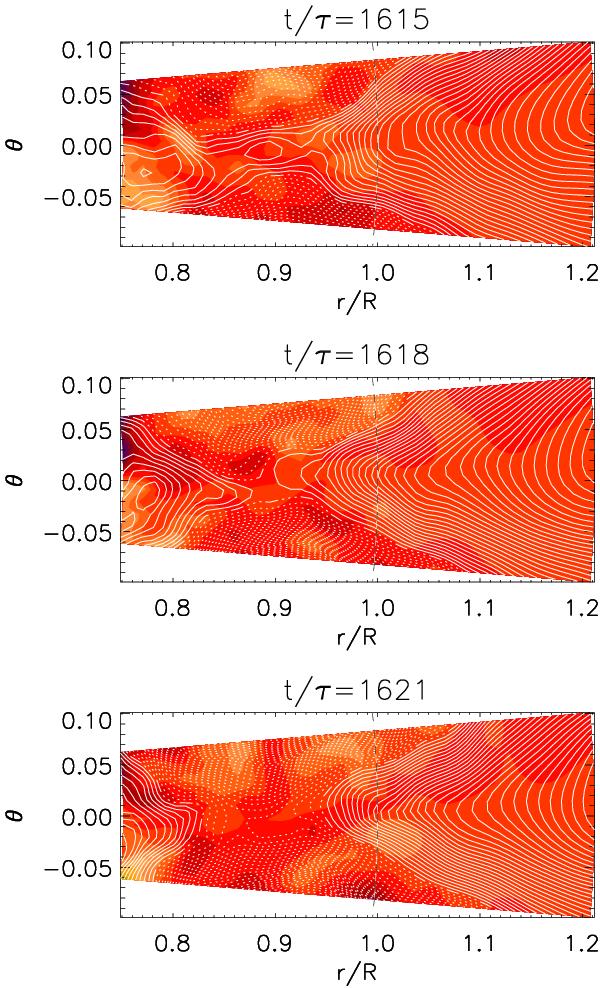
Time series of a reconnection event in an X-point as a close-up view. Contours of  are shown together with a color-scale representation of
  ; dark blue stands for negative and light yellow for positive values. The contours of correspond to field lines of
  in the rθ plane, where solid lines represent counter-clockwise magnetic field lines and the dash ones clockwise. The dashed vertical lines show the location of the surface at r = R. Taken from Run D.
Current usage metrics show cumulative count of Article Views (full-text article views including HTML views, PDF and ePub downloads, according to the available data) and Abstracts Views on Vision4Press platform.
Data correspond to usage on the plateform after 2015. The current usage metrics is available 48-96 hours after online publication and is updated daily on week days.
Initial download of the metrics may take a while.