Free Access
Fig. 3
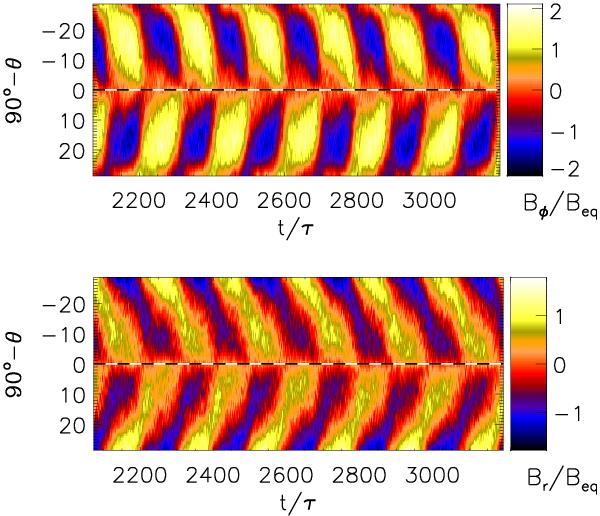
Periodic variation of  and
and  in the turbulence zone. Dark blue stands for negative and light yellow for positive values. The dotted horizontal lines show the location of the equator at θ = π/2. The magnetic field is normalized by the equipartition value. Taken from Run A.
This figure is made of several images, please see below:
Current usage metrics show cumulative count of Article Views (full-text article views including HTML views, PDF and ePub downloads, according to the available data) and Abstracts Views on Vision4Press platform.
Data correspond to usage on the plateform after 2015. The current usage metrics is available 48-96 hours after online publication and is updated daily on week days.
Initial download of the metrics may take a while.