Free Access
Fig. 15
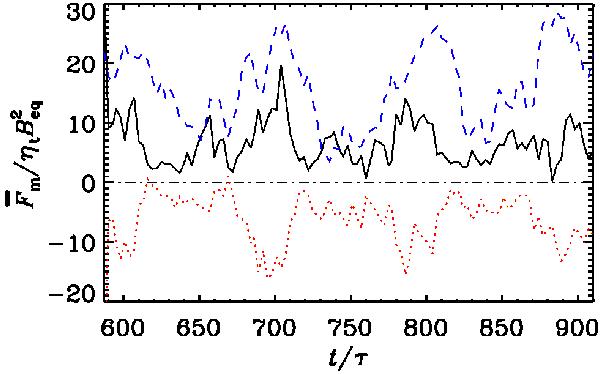
Time evolution of the magnetic helicity flux of the large-scale field, smooth over two data points. Here, the mean of magnetic helicity flux out through the surface of the northern hemisphere (black) is shown, together with that through the southern hemisphere (dotted red), and the equator (dashed blue).
Current usage metrics show cumulative count of Article Views (full-text article views including HTML views, PDF and ePub downloads, according to the available data) and Abstracts Views on Vision4Press platform.
Data correspond to usage on the plateform after 2015. The current usage metrics is available 48-96 hours after online publication and is updated daily on week days.
Initial download of the metrics may take a while.