Fig. 12
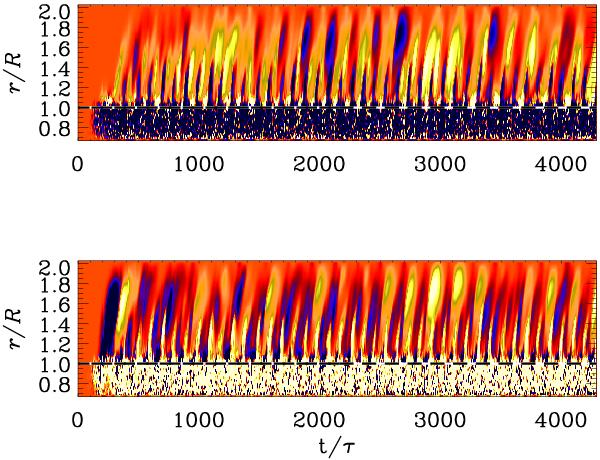
Dependence of the dimensionless ratio  on time t/τ and radius r in terms of the solar radius. The top panel shows a narrow band in θ in the northern hemisphere and the bottom one a thin band in the southern hemisphere. In both plots we have also averaged in latitude from 20° to 28°. Dark blue stands for negative and light yellow for positive values. The dotted horizontal lines show the location of the surface at r = R.
Current usage metrics show cumulative count of Article Views (full-text article views including HTML views, PDF and ePub downloads, according to the available data) and Abstracts Views on Vision4Press platform.
Data correspond to usage on the plateform after 2015. The current usage metrics is available 48-96 hours after online publication and is updated daily on week days.
Initial download of the metrics may take a while.