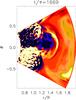
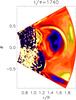
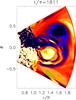
Fig. 11
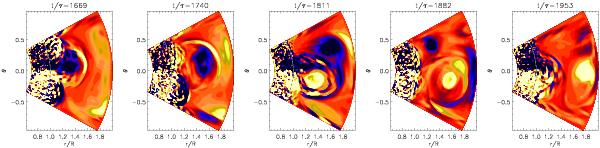
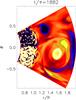
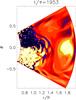
Time series of coronal ejections in spherical coordinates. The normalized current helicity,  , is shown in a color-scale representation for different times; dark blue stands for negative and light yellow for positive values. The dashed horizontal lines show the location of the surface at r = R. Taken from Run D. The temporal evolution is shown in a movie available as online material.
Current usage metrics show cumulative count of Article Views (full-text article views including HTML views, PDF and ePub downloads, according to the available data) and Abstracts Views on Vision4Press platform.
Data correspond to usage on the plateform after 2015. The current usage metrics is available 48-96 hours after online publication and is updated daily on week days.
Initial download of the metrics may take a while.