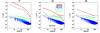
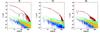
Fig. 10

Residuals spectra after destriping the signal plus noise in the three cases of (1) pure white noise (blue), low frequency noise plus white noise with (α = 2, fknee = 0.1 Hz), (2) (α = 2, fknee = 0.01 Hz) and (α = 1, fknee = 0.1 Hz) compared to the simulation power spectra (red), and (3) CMB WMAP five-year fiducial model (black) on 100 simulations. Upper line, from left to right: temperature, E-mode, and B-mode. Bottom line, from left to right: cross-correlation TE, TB, and EB.
Current usage metrics show cumulative count of Article Views (full-text article views including HTML views, PDF and ePub downloads, according to the available data) and Abstracts Views on Vision4Press platform.
Data correspond to usage on the plateform after 2015. The current usage metrics is available 48-96 hours after online publication and is updated daily on week days.
Initial download of the metrics may take a while.