Fig. A.1
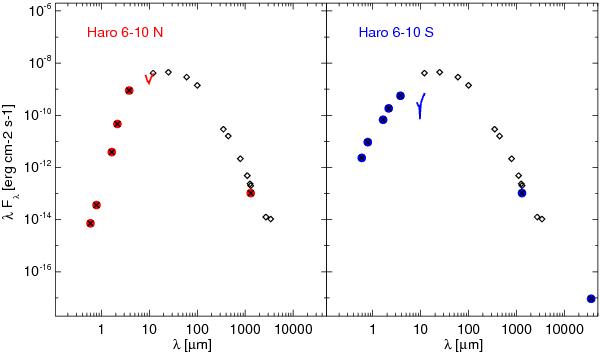
SED of Haro 6-10. The empty diamonds points represent the photometric measurements of the unresolved binary. The fluxes of the single components are presented as red (Haro 6-10 N) and blue (Haro 6-10 S) filled dots. The continuous lines represent the MIDI spectra of both components.
Current usage metrics show cumulative count of Article Views (full-text article views including HTML views, PDF and ePub downloads, according to the available data) and Abstracts Views on Vision4Press platform.
Data correspond to usage on the plateform after 2015. The current usage metrics is available 48-96 hours after online publication and is updated daily on week days.
Initial download of the metrics may take a while.