Free Access
Fig. 2
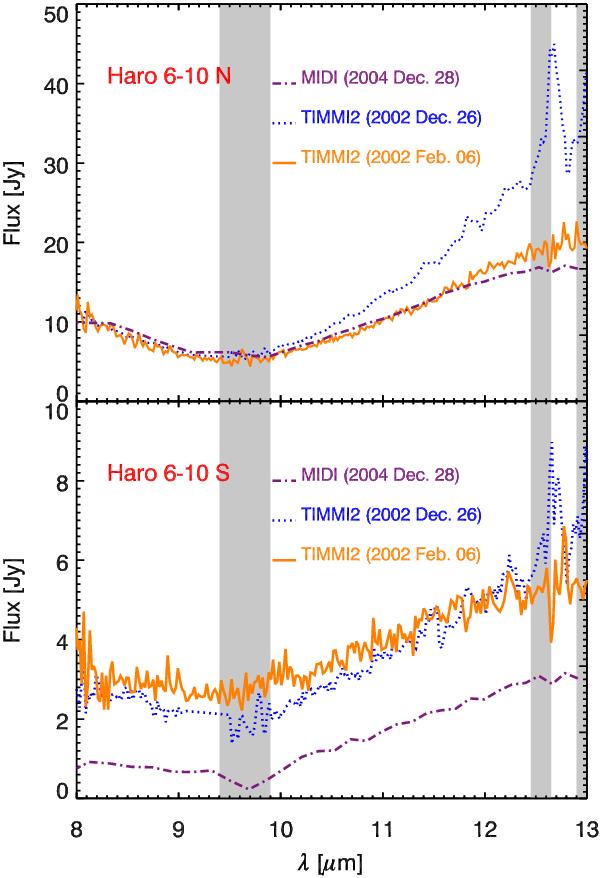
TIMMI 2 spectrum of Haro 6-10 N (IRC) (top) and Haro 6-10 S (below). The grey highlighted pattern correspond to strong atmospheric O3 and CO2 absorption bands at 9.6 and 12.5 μm, respectively. The measurements in these regions are not considered in our following analysis.
Current usage metrics show cumulative count of Article Views (full-text article views including HTML views, PDF and ePub downloads, according to the available data) and Abstracts Views on Vision4Press platform.
Data correspond to usage on the plateform after 2015. The current usage metrics is available 48-96 hours after online publication and is updated daily on week days.
Initial download of the metrics may take a while.