Fig. 9
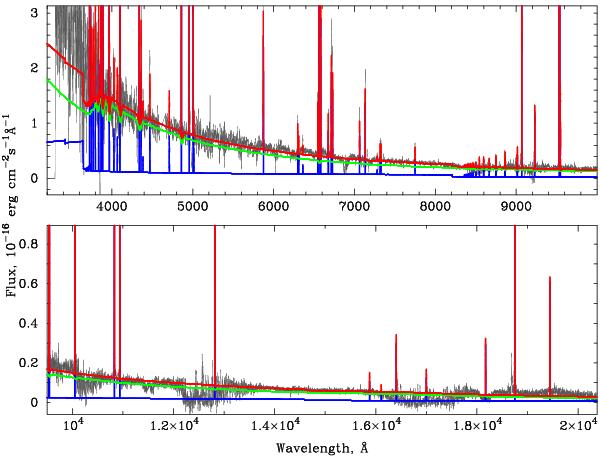
Best-fit model SED to the redshift- and extinction-corrected observed spectrum. The contributions from the stellar and ionised gas components are shown by green and blue lines, respectively. The sum of both stellar and ionised gas emission is shown by the red line. Evidently, the spectrum in the whole wavelength range ~λλ3200–24 000 Å is fitted quite well despite the strong absorption features in the NIR caused by telluric lines. (A colour version of this figure is available in the online journal.)
Current usage metrics show cumulative count of Article Views (full-text article views including HTML views, PDF and ePub downloads, according to the available data) and Abstracts Views on Vision4Press platform.
Data correspond to usage on the plateform after 2015. The current usage metrics is available 48-96 hours after online publication and is updated daily on week days.
Initial download of the metrics may take a while.