Fig. 7
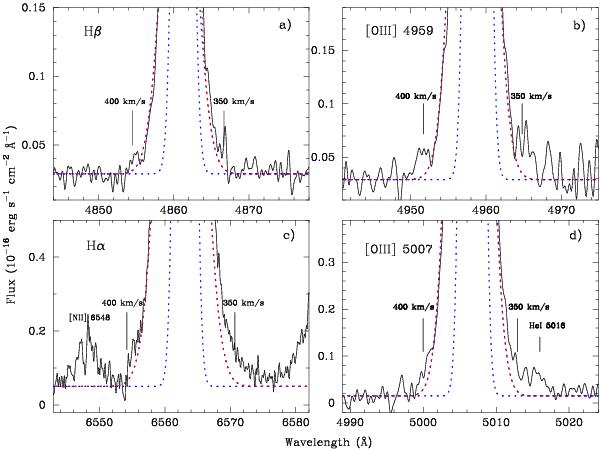
Velocity excess in emission line profiles of a) Hβλ4861; b) [O iii] λ4959; c) Hαλ 6563 and d) [O iii] λ5007. Observational data are shown by solid lines and fits by dotted lines (narrow and broad components of lines in blue and summed fits in red). The positions of the blue-shifted v = 400 km s-1 and red-shifted v = 350 km s-1 broad components are shown by straight lines.
Current usage metrics show cumulative count of Article Views (full-text article views including HTML views, PDF and ePub downloads, according to the available data) and Abstracts Views on Vision4Press platform.
Data correspond to usage on the plateform after 2015. The current usage metrics is available 48-96 hours after online publication and is updated daily on week days.
Initial download of the metrics may take a while.