Fig. 6
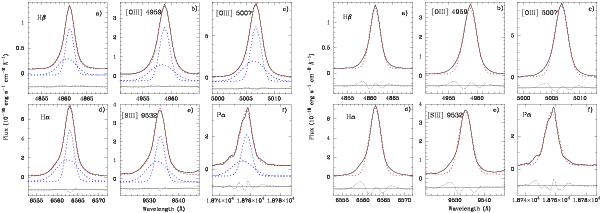
Left panel. Decomposition of strong emission-line profiles into two Gaussian components in the spectrum of HG 031203 for: a) Hβλ4861; b) [O iii] λ4959; c) [O iii] λ5007; d) Hαλ 6563; e) [S iii] λ9532 and f) Paαλ18756. The observed spectrum and the fit are shown by black solid and red dashed lines. The two Gaussian components and residual spectra are shown by blue dashed and black dotted lines. For convenience the observed spectra, Gaussians, and residual are shifted. Right panel. The same as in left panel, but the strong emission line profiles fitted by the single Gaussian.
Current usage metrics show cumulative count of Article Views (full-text article views including HTML views, PDF and ePub downloads, according to the available data) and Abstracts Views on Vision4Press platform.
Data correspond to usage on the plateform after 2015. The current usage metrics is available 48-96 hours after online publication and is updated daily on week days.
Initial download of the metrics may take a while.