Fig. 5
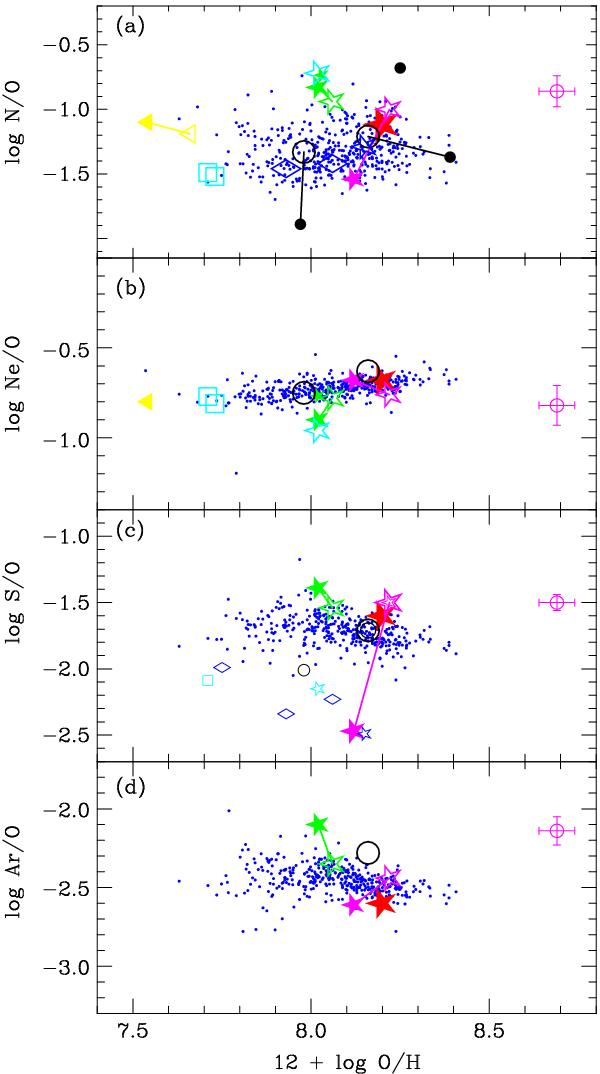
Abundance ratios log N/O a), log Ne/O b), log S/O c) and log Ar/O d) vs. oxygen abundance 12 + log O/H for HG 031203 (this paper) and for LCGs from SDSS DR7 (Izotov et al. 2011a) are shown by large red filled stars and small blue filled circles, respectively. Data from the literature and recalculated from published emission line fluxes are shown by filled and open symbols, respectively. All data for HG 031203 are shown by stars of different colours. Specifically, Margutti et al. (2007): filled and open purple stars, Hammer et al. (2006): filled and open black circles, Wiersema et al. (2007): filled yellow triangles, Levesque et al. (2010a): open light blue squares, Han et al. (2010): open blue rhombs, Prochaska et al. (2004): filled green stars (see text). The solar abundance ratios by Asplund et al. (2009) are indicated by the large purple open circles and the associated error bars. (A colour version of this figure is available in the online journal.)
Current usage metrics show cumulative count of Article Views (full-text article views including HTML views, PDF and ePub downloads, according to the available data) and Abstracts Views on Vision4Press platform.
Data correspond to usage on the plateform after 2015. The current usage metrics is available 48-96 hours after online publication and is updated daily on week days.
Initial download of the metrics may take a while.