Fig. 4
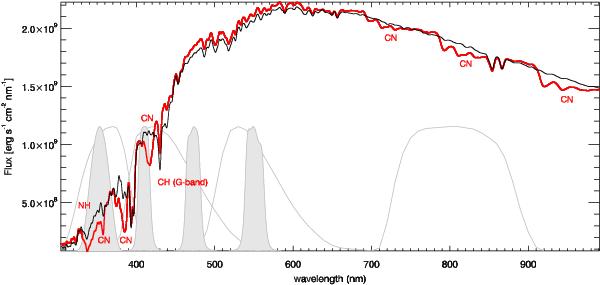
Flux distribution for the RGB model with Teff = 4476 K and log g = 1.2 for the reference mixture (black) and the CNONa1 mixture (red), both with the standard helium content of Y = 0.246. We superimposed the transmission curves for the Johnson-Cousins U, B, V, and I filters (thin, black lines; left to right) and for the Strögren uvby filtes (grey-shaded regions). The synthetic spectra are broadened by convolution with a Gaussian of FWHM = 1700 km s-1 for readability purposes to roughly match the resolution of the Castelli & Kurucz (2004) ATLAS9-based fluxes. A number of molecular bands, which vary significantly between the two mixtures, are labelled by the name of the corresponding molecule.
Current usage metrics show cumulative count of Article Views (full-text article views including HTML views, PDF and ePub downloads, according to the available data) and Abstracts Views on Vision4Press platform.
Data correspond to usage on the plateform after 2015. The current usage metrics is available 48-96 hours after online publication and is updated daily on week days.
Initial download of the metrics may take a while.