Fig. 3
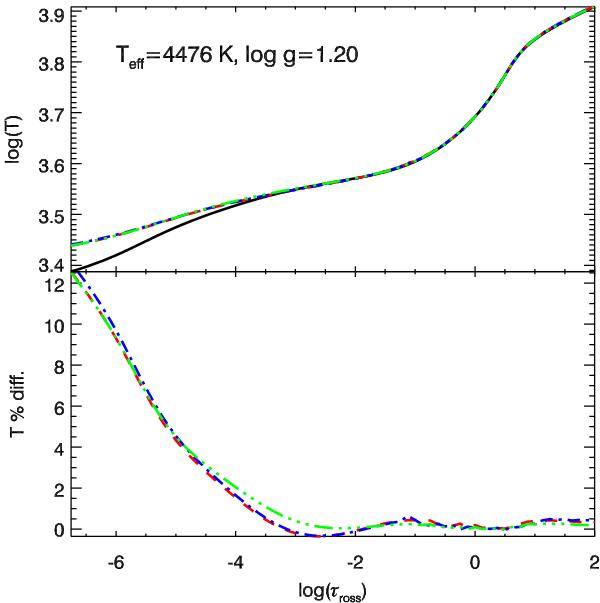
Comparison of the temperature stratification for the four Teff = 4476 K, log g = 1.2 giant models (upper panel). The solid line denotes the reference mixture, the dashed line the CNONa mixture with Y = 0.246, the dot-dashed line the CNONa1 mixture with Y = 0.4, and the dash-dot-dot line the CNONa2 mixture. In the lower panel the percentage temperature difference for the last three mixtures with respect to the reference one is plotted; colour and line type are coded as in the upper panel.
Current usage metrics show cumulative count of Article Views (full-text article views including HTML views, PDF and ePub downloads, according to the available data) and Abstracts Views on Vision4Press platform.
Data correspond to usage on the plateform after 2015. The current usage metrics is available 48-96 hours after online publication and is updated daily on week days.
Initial download of the metrics may take a while.