Fig. 2
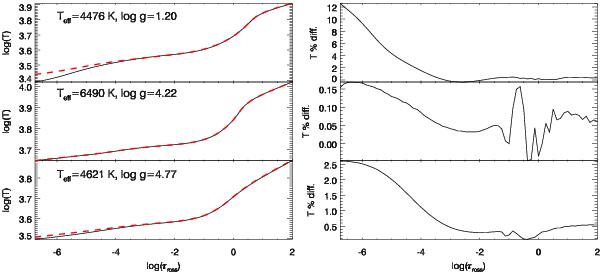
Temperature structures for a MS, TO, and a RGB atmosphere as used in the present work (left panel). The black continuous line represents the model computed with the reference chemical mixture, the red dashed line the one assuming the CNONa1 mixture. In both cases, Y = 0.246. The right panel shows the percentage temperature difference between the two different chemical compositions.
Current usage metrics show cumulative count of Article Views (full-text article views including HTML views, PDF and ePub downloads, according to the available data) and Abstracts Views on Vision4Press platform.
Data correspond to usage on the plateform after 2015. The current usage metrics is available 48-96 hours after online publication and is updated daily on week days.
Initial download of the metrics may take a while.