Fig. 7
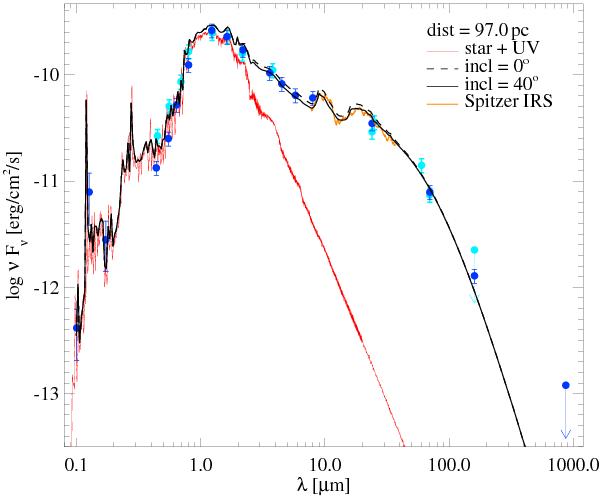
Comparison of model SED to observations. Blue bullets are photometric data points used for the fitting (see Table 2). Light blue symbols refer to other, unused photometry points. Symbols with downward arrows indicate 3σ upper limits. The black line is the SED from our best-fitting model. The red line shows the assumed stellar input spectrum, completed by piecewise constant fluxes Fν in three UV bands as obtained by integrating over our UV observations (Table 3).
Current usage metrics show cumulative count of Article Views (full-text article views including HTML views, PDF and ePub downloads, according to the available data) and Abstracts Views on Vision4Press platform.
Data correspond to usage on the plateform after 2015. The current usage metrics is available 48-96 hours after online publication and is updated daily on week days.
Initial download of the metrics may take a while.