Fig. 3
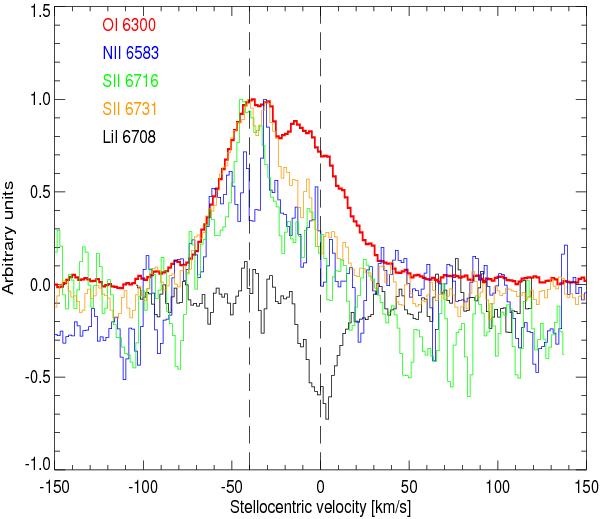
Optical line spectra of ET Cha. All line profiles are continuum subtracted and normalised to line peak emission = 1. The forbidden oxygen line [OI] 6300 Å is the strongest emission line by a factor 5 or more, see Table 4, hence the increased noise level in the other lines. The dip in the [OI] 6300 Å line coincides with the position of the telluric component which has been carefully removed, see text. The LiI 6708 Å absorption line has been used to determine the stellar velocity.
Current usage metrics show cumulative count of Article Views (full-text article views including HTML views, PDF and ePub downloads, according to the available data) and Abstracts Views on Vision4Press platform.
Data correspond to usage on the plateform after 2015. The current usage metrics is available 48-96 hours after online publication and is updated daily on week days.
Initial download of the metrics may take a while.