Fig. 7
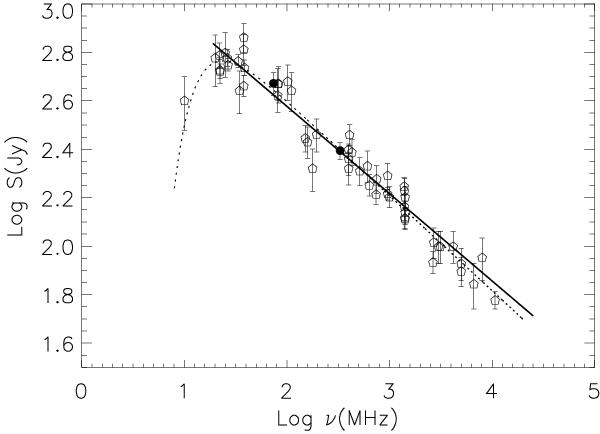
Radio continuum spectrum for SNR IC 443 obtained from the flux density values listed in Table 2. The filled circle symbols correspond to the new flux density measurements calculated using the VLA data at 74 and 330 MHz presented in this work, the open symbols are for radio observations previously published and, where possible, brought onto the flux density scale of Baars et al. (1977). Solid line represents the linear fit to the flux density values excluding that at 10 MHz, which produces a spectral index α = −0.36 ± 0.02 (S ∝ να). Dotted line shows a fit to all of the plotted values if absorption were present (Eq. (1)), which yields a spectral index α = −0.39 ± 0.01.
Current usage metrics show cumulative count of Article Views (full-text article views including HTML views, PDF and ePub downloads, according to the available data) and Abstracts Views on Vision4Press platform.
Data correspond to usage on the plateform after 2015. The current usage metrics is available 48-96 hours after online publication and is updated daily on week days.
Initial download of the metrics may take a while.