Fig. 8
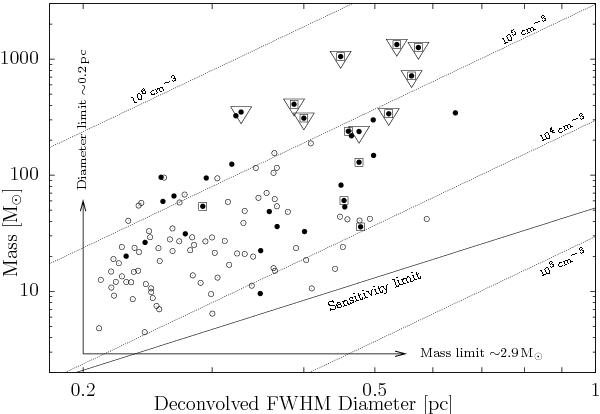
Mass versus diameter for the clumps detected toward the GMC G345.5+1.0 in 1.2 mm continuum emission with reliable diameters. Filled circles indicate clumps detected in infrared MSX and Spitzer bands. Open circles indicate clumps that do not have an infrared counterpart. Triangles indicate clumps associated with MSFR-IRAS sources, which have luminosities >103 L⊙. Boxes indicate clumps associated with MSX sources that satisfy MYSO candidate criterion (Lumsden et al. 2002). Arrows mark detection limits for masses (~2.9 M⊙) and diameters (~0.2 pc). The continuous line indicates the detectable mass as a function of diameter (sensitivity limit), considering an intensity limit of five rms (~0.1 Jy beam-1). Dotted lines indicate mean densities at 103, 104, 105 and 106 cm-3. The densities are computed assuming a mean molecular weight of μ = 2.29.
Current usage metrics show cumulative count of Article Views (full-text article views including HTML views, PDF and ePub downloads, according to the available data) and Abstracts Views on Vision4Press platform.
Data correspond to usage on the plateform after 2015. The current usage metrics is available 48-96 hours after online publication and is updated daily on week days.
Initial download of the metrics may take a while.