Fig. 7
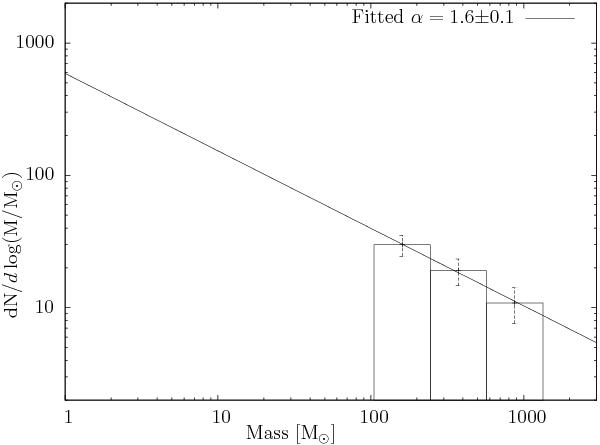
Mass distribution of identified clumps in G345.5+1.0 with masses higher than 100 M⊙, plotted as dN/dlog (M/M⊙) versus mass, where dN/dlog (M/M⊙) is approximated by the number of clumps ΔN within a logarithmic mass interval Δlog (M/M⊙). Here, Δlog (M/M⊙) is constant, ~0.37. Error bars are estimated by  . The continuous line represents the mass distribution fit with dN/dlog (M/M⊙) ∝ M1 − α, where the spectral mass index α is 1.6 ± 0.1 for masses between ~100 and 1.3 × 10³ M⊙.
Current usage metrics show cumulative count of Article Views (full-text article views including HTML views, PDF and ePub downloads, according to the available data) and Abstracts Views on Vision4Press platform.
Data correspond to usage on the plateform after 2015. The current usage metrics is available 48-96 hours after online publication and is updated daily on week days.
Initial download of the metrics may take a while.