Fig. 5
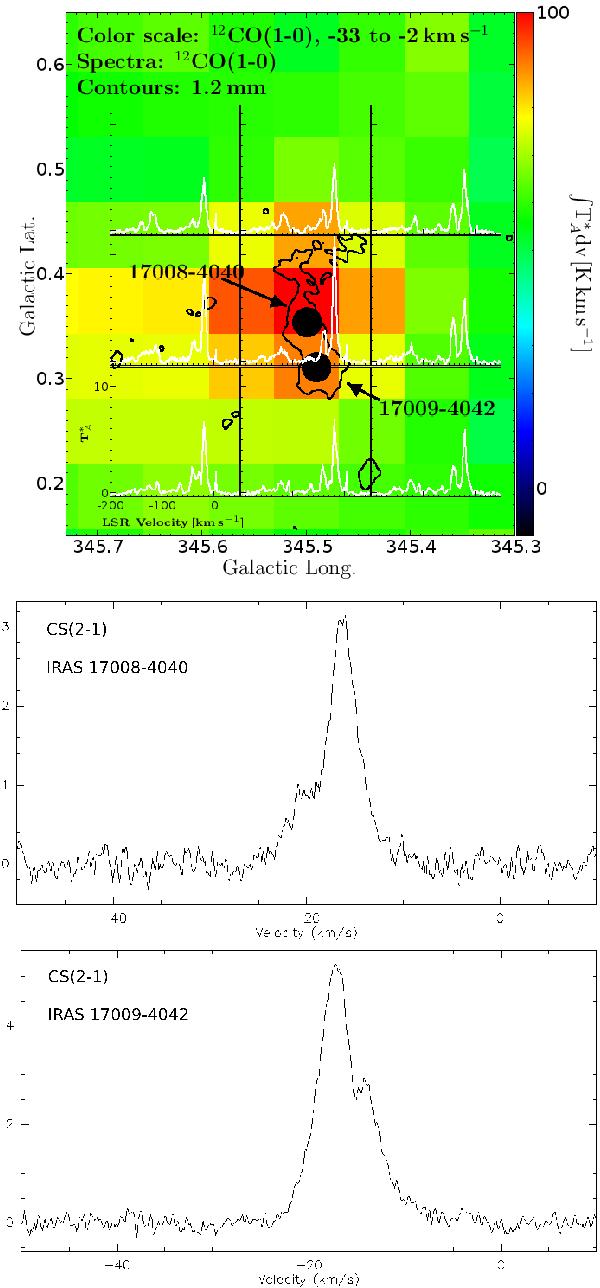
Line profiles toward the IRAS point sources 17008-4040 and 17009-4042: top image, 12CO(1–0) line profiles (Bronfman et al. 1989), over a map of their integrated emissions (color scale) and with contours of 1.2 mm continuum emission; middle and bottom images, CS(2–1) line profiles (their observing positions are indicated as black dots in the top image; Bronfman et al. 1996).
Current usage metrics show cumulative count of Article Views (full-text article views including HTML views, PDF and ePub downloads, according to the available data) and Abstracts Views on Vision4Press platform.
Data correspond to usage on the plateform after 2015. The current usage metrics is available 48-96 hours after online publication and is updated daily on week days.
Initial download of the metrics may take a while.