Fig. 11
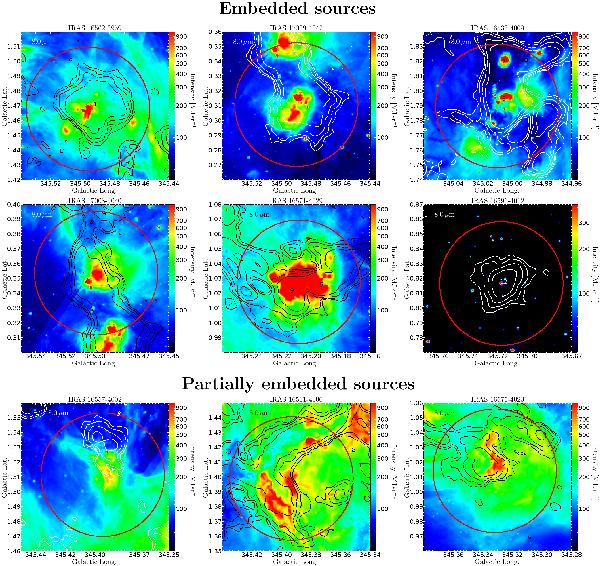
Images of 8.0 μm emission (Spitzer data) toward clumps detected in 1.2 mm continuum emission and associated with IRAS point sources. Contours represent 1.2 mm continuum emission at 0.06, 0.12, 0.24, and 0.48 Jy beam-1 (rms is 0.02 Jy beam-1). IRAS source names are given at the top of each image, and clump numbers are indicated at the peak of 1.2 mm continuum emission. Red circles are centered on the coordinates of IRAS point sources, with diameters of 5′ (an approximation of the angular resolution of IRAS observations at 100 μm).
Current usage metrics show cumulative count of Article Views (full-text article views including HTML views, PDF and ePub downloads, according to the available data) and Abstracts Views on Vision4Press platform.
Data correspond to usage on the plateform after 2015. The current usage metrics is available 48-96 hours after online publication and is updated daily on week days.
Initial download of the metrics may take a while.