Fig. 8
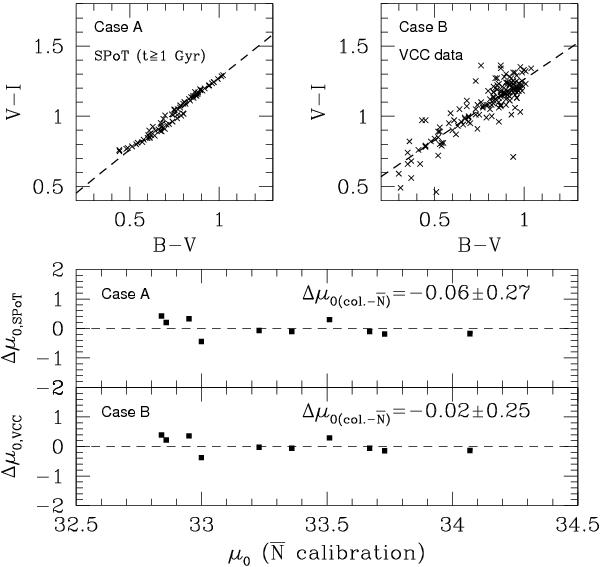
Upper panels: V − I versus B − V relations derived from the SPoT models (left panel Raimondo et al. 2005, models are shown with crosses), and from the integrated colours of Virgo cluster galaxies (right panel). The linear fit to models is shown with dashed line. Lower panels: difference between the distance moduli obtained using the SBF calibration from the V − I colour and from the  . Each panel shows the case of V − I derived from the relations shown in the upper panels, as labelled.
Current usage metrics show cumulative count of Article Views (full-text article views including HTML views, PDF and ePub downloads, according to the available data) and Abstracts Views on Vision4Press platform.
Data correspond to usage on the plateform after 2015. The current usage metrics is available 48-96 hours after online publication and is updated daily on week days.
Initial download of the metrics may take a while.