Free Access
Fig. 4
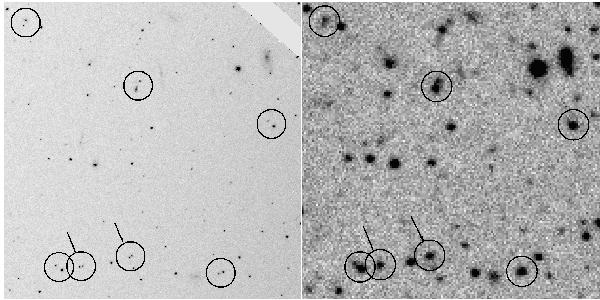
Same 30′ × 30′ region of NGC 4696 as seen by the HST/ACS (left panel) and VLT/FORS1 (right panel) cameras. The circles mark the sources that are blended in the VLT frame. The most severe cases are emphasised with arrows.
Current usage metrics show cumulative count of Article Views (full-text article views including HTML views, PDF and ePub downloads, according to the available data) and Abstracts Views on Vision4Press platform.
Data correspond to usage on the plateform after 2015. The current usage metrics is available 48-96 hours after online publication and is updated daily on week days.
Initial download of the metrics may take a while.