Fig. 7
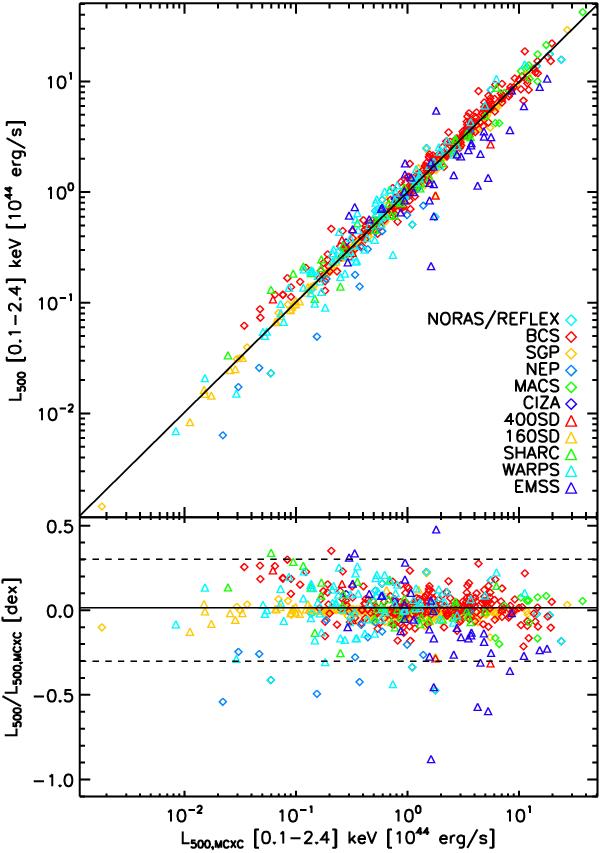
Luminosity L500 of the overlaps (top panel) and the ratio L500 / L500,MCXC in dex (bottom panel) as a function of L500,MCXC, the luminosity measurements retained in the MCXC. Symbols and colors are the same as in Fig. 4, but refer to the overlaps only. The solid line in the top panel indicates the best fit to the data. The solid line in the bottom panel indicates the error weighted mean of the luminosity ratio, while the dashed horizontal lines indicates the luminosity ratios equal to 2 and 0.5.
Current usage metrics show cumulative count of Article Views (full-text article views including HTML views, PDF and ePub downloads, according to the available data) and Abstracts Views on Vision4Press platform.
Data correspond to usage on the plateform after 2015. The current usage metrics is available 48-96 hours after online publication and is updated daily on week days.
Initial download of the metrics may take a while.