Fig. 6
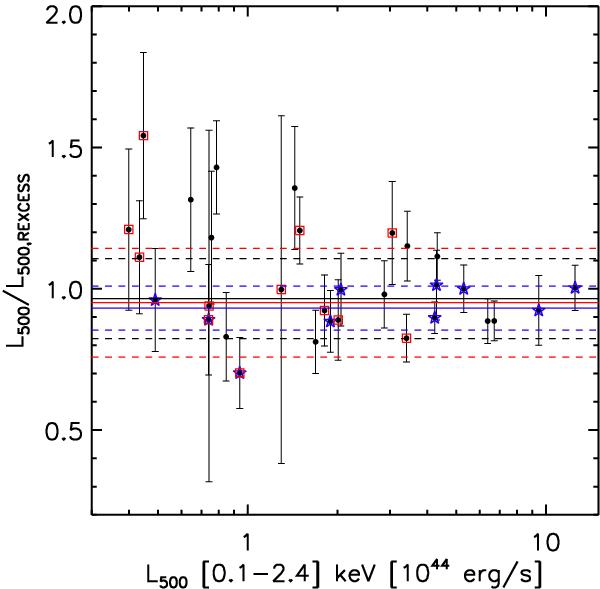
Ratio between our estimate of the 0.1−2.4 keV band luminosities L500 and the XMM-Newton measurements of Pratt et al. (2009) as a function of L500. Blue stars indicate cool core clusters while red squares morphologically disturbed clusters. Solid lines indicate error weighted means and dashed lines represent the error weighted means ± error weighted standard deviations (black for all clusters, blue for cool core clusters, and red for morphologically disturbed clusters as defined in Pratt et al. 2009).
Current usage metrics show cumulative count of Article Views (full-text article views including HTML views, PDF and ePub downloads, according to the available data) and Abstracts Views on Vision4Press platform.
Data correspond to usage on the plateform after 2015. The current usage metrics is available 48-96 hours after online publication and is updated daily on week days.
Initial download of the metrics may take a while.