Free Access
Fig. 4
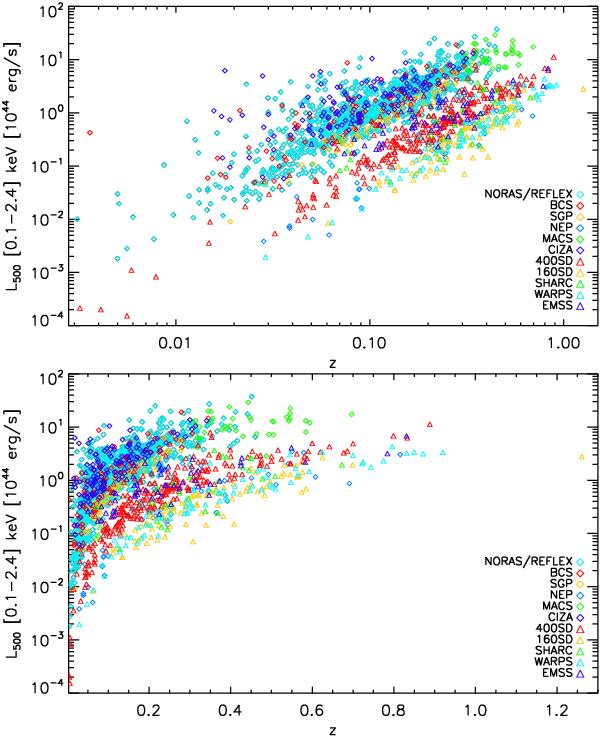
Top: the 0.1−2.4 keV band luminosities L500 of the 1743 MCXC clusters as a function of redshift. Diamonds and triangles indicate clusters from RASS-based and serendipitous catalogues, respectively. Bottom: same, but in lin-log scale.
This figure is made of several images, please see below:
Current usage metrics show cumulative count of Article Views (full-text article views including HTML views, PDF and ePub downloads, according to the available data) and Abstracts Views on Vision4Press platform.
Data correspond to usage on the plateform after 2015. The current usage metrics is available 48-96 hours after online publication and is updated daily on week days.
Initial download of the metrics may take a while.