Fig. 2
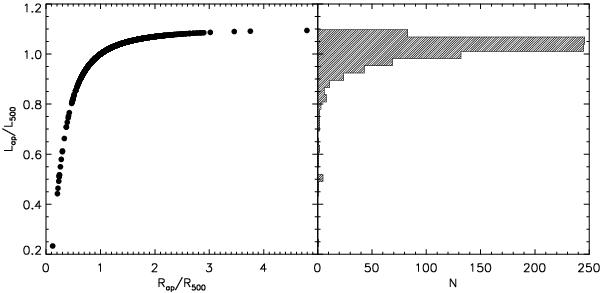
Relation between input quantities Rap and Lap = L(<Rap) and the iteratively estimated R500 and L500 = L(<R500) for the NORAS/REFLEX clusters. The luminosity ratio as a function of aperture radius ratio is shown in the left panel, while the luminosity ratio histogram is shown in the right panel.
Current usage metrics show cumulative count of Article Views (full-text article views including HTML views, PDF and ePub downloads, according to the available data) and Abstracts Views on Vision4Press platform.
Data correspond to usage on the plateform after 2015. The current usage metrics is available 48-96 hours after online publication and is updated daily on week days.
Initial download of the metrics may take a while.