Fig. 8
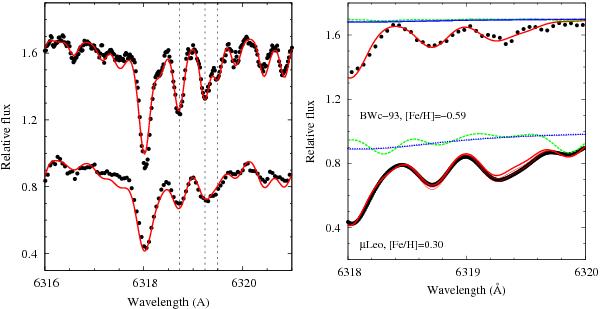
Left panel: observed spectrum (black points) around the Mg i triplet for the BWc-1 red clump star obtained with GIRAFFE (lower spectrum) and UVES (upper spectrum). The red lines represent the synthetic spectra computed with [Mg/H] = +0.34 and [Mg/H] = +0.38 respectively for GIRAFFE and UVES convolution. Right panel: comparison of observed (black points) and synthetic spectra (red lines) computed with [Mg/H] = −0.16 for the red clump star BWc-93 and [Mg/H] = +0.42,+0.32,+0.22 for μLeo. The blue dotted lines and the green thick dashed lines represent the absorption of the Ca i line and of the CN lines respectively.
Current usage metrics show cumulative count of Article Views (full-text article views including HTML views, PDF and ePub downloads, according to the available data) and Abstracts Views on Vision4Press platform.
Data correspond to usage on the plateform after 2015. The current usage metrics is available 48-96 hours after online publication and is updated daily on week days.
Initial download of the metrics may take a while.