Fig. 14
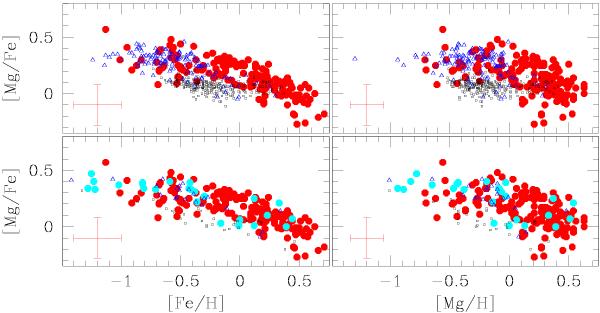
[Mg/Fe] as a function of [Fe/H] (right panel) and [Mg/H] (left panel) for our bulge red clump sample (red points) compared with thick (blue) and thin (black) discs stars. In the two upper panels, the disc reference samples are from the main sequence stars studies of Bensby et al. (2005) (triangles), Reddy et al. (2006) (squares), Fuhrmann (2008) (crosses), whereas the two lower panels show the solar neighbourhood disc giants by Alves-Brito et al. (2010), as well as their bulge giants (large filled cyan circles). In the low metallicity range ([Fe/H] < −0.3 and [Mg/H] < 0), the thick disc and the bulge show similar [Mg/Fe] ratios, higher than in thin disc stars.
Current usage metrics show cumulative count of Article Views (full-text article views including HTML views, PDF and ePub downloads, according to the available data) and Abstracts Views on Vision4Press platform.
Data correspond to usage on the plateform after 2015. The current usage metrics is available 48-96 hours after online publication and is updated daily on week days.
Initial download of the metrics may take a while.