Fig. 1
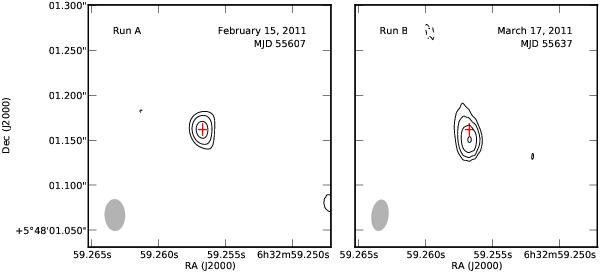
EVN radio images of HESS J0632+057 at 1.6 GHz during the X-ray outburst and 30 days later. North is up and east to the left. The observation dates are quoted at the top of each panel. The synthesized beam (see Table 1) is displayed in the bottom-left corner of each image. The red crosses mark the position and 3σ uncertainty of the fitted component of run A. For each image, the displayed contours start at 3σ and increase by factors of 21/2; the 1σ rms close to the source is 50 μJy beam-1 in run A and 13 μJy beam-1 in run B.
Current usage metrics show cumulative count of Article Views (full-text article views including HTML views, PDF and ePub downloads, according to the available data) and Abstracts Views on Vision4Press platform.
Data correspond to usage on the plateform after 2015. The current usage metrics is available 48-96 hours after online publication and is updated daily on week days.
Initial download of the metrics may take a while.