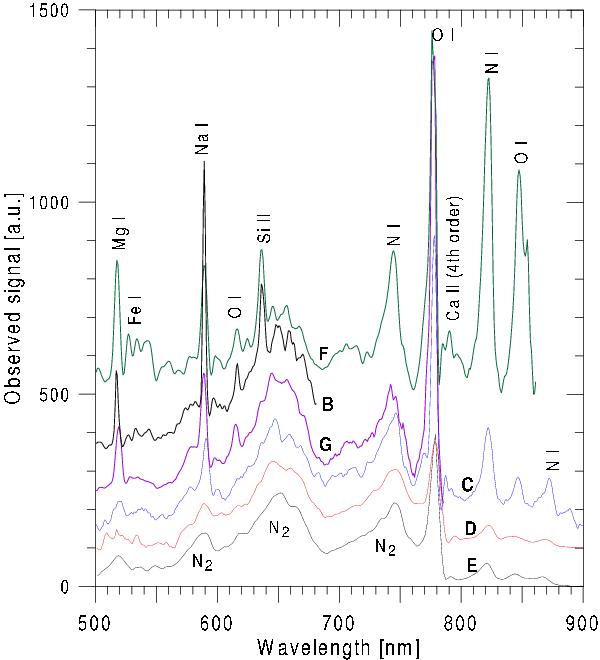
Fig. 5

Raw spectra of fireballs TN171109B to TN171109G at their maximum light. The observed signal is plotted as a function of wavelength. Fireballs D and E were captured in the −1st first spectral order and their spectra have therefore half the resolution of the spectra of all other fireballs, which were captured in the −2nd second order. Because the camera sensitivity as a function of wavelength differs in different orders, the observed signal of fireballs D and E was recomputed as if they were observed in the −2nd second order. For clarity the spectra have been offset vertically. Fainter spectra are given at the bottom, the brightest spectrum (fireball F) is at the top. The top of the brightest line, O i at 777 nm, was cut in spectra G and F.
Current usage metrics show cumulative count of Article Views (full-text article views including HTML views, PDF and ePub downloads, according to the available data) and Abstracts Views on Vision4Press platform.
Data correspond to usage on the plateform after 2015. The current usage metrics is available 48-96 hours after online publication and is updated daily on week days.
Initial download of the metrics may take a while.


