Fig. 7
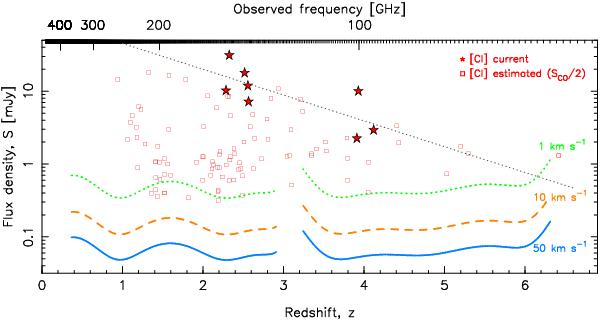
As per Fig. 6 but showing the expected flux density of the [C i] emission based upon SCO ≈ 2 × S [C i] (Fig. 5). The dotted, broken and full traces show the rms sensitivity of the full ALMA array per each 1, 10 and 50 km s-1 channel for the conditions used above (10 h on source at a declination of δ = −30° and a vapour column density of 1.262 mm). The lower redshift trace spans the range given by the band-7, 6, 5 and 4 receivers (370−125 GHz) and the higher redshift spans that given by the band-3 and 2 receivers (116−67 GHz). The frequency scale is derived for the redshift of the [C i]  transition. The stars show the known high redshifted [C i] emitters with the dotted line showing the least-squares fit to these.
Current usage metrics show cumulative count of Article Views (full-text article views including HTML views, PDF and ePub downloads, according to the available data) and Abstracts Views on Vision4Press platform.
Data correspond to usage on the plateform after 2015. The current usage metrics is available 48-96 hours after online publication and is updated daily on week days.
Initial download of the metrics may take a while.