Fig. 6
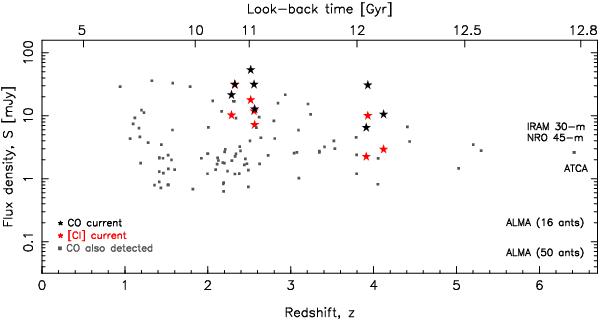
The flux density (S = I/FWHM) of the CO and [C i] emitters versus redshift. The black stars show the current redshifted CO emitters which also exhibit [C i] emission (designated by coloured stars). The small squares show all of the other published z ≥ 1 CO emitters. The telescope labels show the expected rms noise level per each 50 km s-1 channel after 10 h of observation with the corresponding telescope at 100 GHz (see main text). The look-back time is calculated using H0 = 71 km s-1 Mpc-1, Ωmatter = 0.27 and ΩΛ = 0.73 (Spergel et al. 2003), which we use throughout the paper.
Current usage metrics show cumulative count of Article Views (full-text article views including HTML views, PDF and ePub downloads, according to the available data) and Abstracts Views on Vision4Press platform.
Data correspond to usage on the plateform after 2015. The current usage metrics is available 48-96 hours after online publication and is updated daily on week days.
Initial download of the metrics may take a while.