Fig. 4
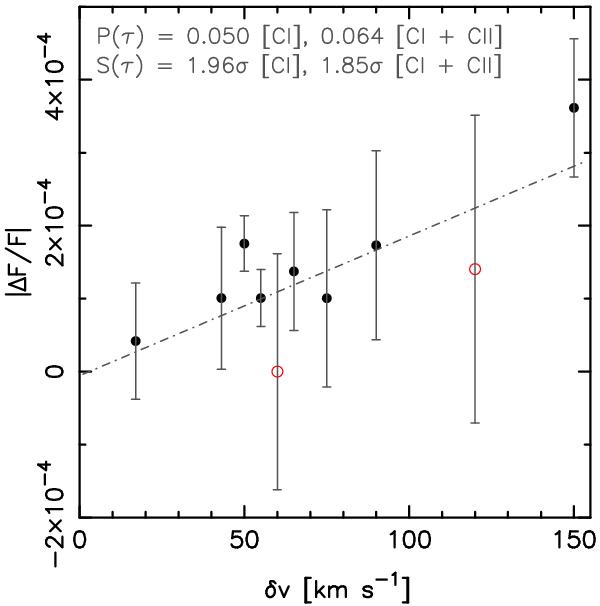
The absolute value of ΔF/F versus the spectral resolution of the [C i] and [C ii] detection. The symbols are as per Fig. 2 and the line shows the least-squares fit to all of the points. P(τ) shows the Kendall’s two-sided probability of the distribution occuring by chance and S(τ) the corresponding significance for the [C i] and [C ii]spectra.
Current usage metrics show cumulative count of Article Views (full-text article views including HTML views, PDF and ePub downloads, according to the available data) and Abstracts Views on Vision4Press platform.
Data correspond to usage on the plateform after 2015. The current usage metrics is available 48-96 hours after online publication and is updated daily on week days.
Initial download of the metrics may take a while.