Fig. 8
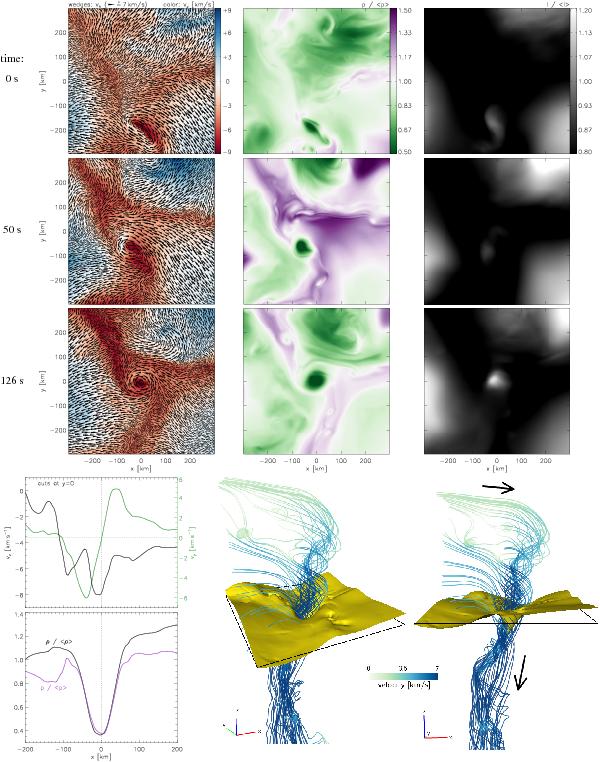
A strong vertical vortex penetrating the optical surface in Run H. The nine panels at the top show, at various stages of development, the velocity (left panels) and gas pressure (middle panels) at the average height of the optical surface (z = 0) together with a bolometric intensity map (right panels). The line plots at the bottom left represent one-dimensional cuts through the vortex at the last instant (t = 126 s). The 3D visualization at the bottom right shows, from two different viewing angles, selected streamlines color coded by velocity and the warped optical surface in yellow; the black rectangle indicates the z = 0 plane.
Current usage metrics show cumulative count of Article Views (full-text article views including HTML views, PDF and ePub downloads, according to the available data) and Abstracts Views on Vision4Press platform.
Data correspond to usage on the plateform after 2015. The current usage metrics is available 48-96 hours after online publication and is updated daily on week days.
Initial download of the metrics may take a while.