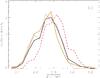
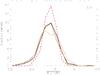
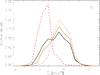
Fig. 7
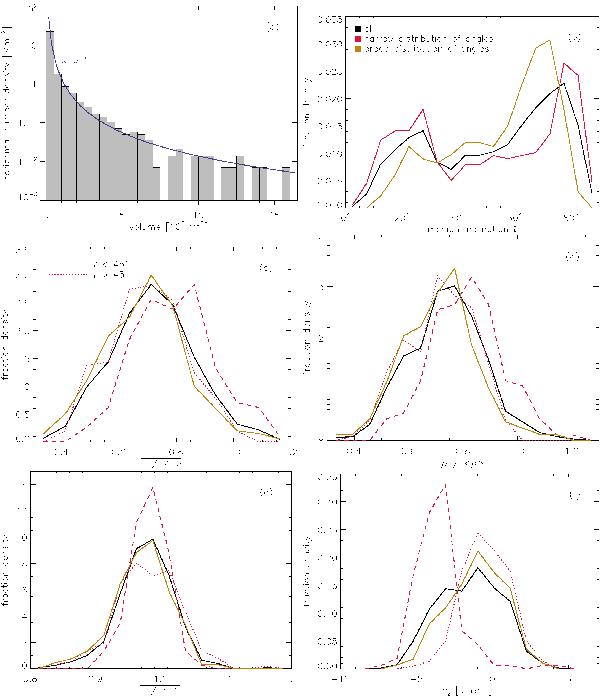
Statistical properties of contiguous vortex features above the optical surface in Run C. The horizontal number density plotted in panel a) is the number of features per horizontal area. In panels b)−f), features are classified by the median inclination  and the width of the distribution about the median. Vertical (horizontal) features are deemed to be those with narrow distributions and small (large) ; they are represented by dashed (dotted) lines in panels c)−f). The plotted fraction densities are histograms normalized such that the integral over all values of the respective abscissa variable is one. In the abscissa labels, angle brackets ⟨ ... ⟩ denote the (height-dependent) horizontal mean of the respective quantity in downflow regions and a bar denotes the mean within a particular feature.
Current usage metrics show cumulative count of Article Views (full-text article views including HTML views, PDF and ePub downloads, according to the available data) and Abstracts Views on Vision4Press platform.
Data correspond to usage on the plateform after 2015. The current usage metrics is available 48-96 hours after online publication and is updated daily on week days.
Initial download of the metrics may take a while.