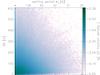
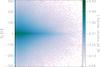
Fig. 5
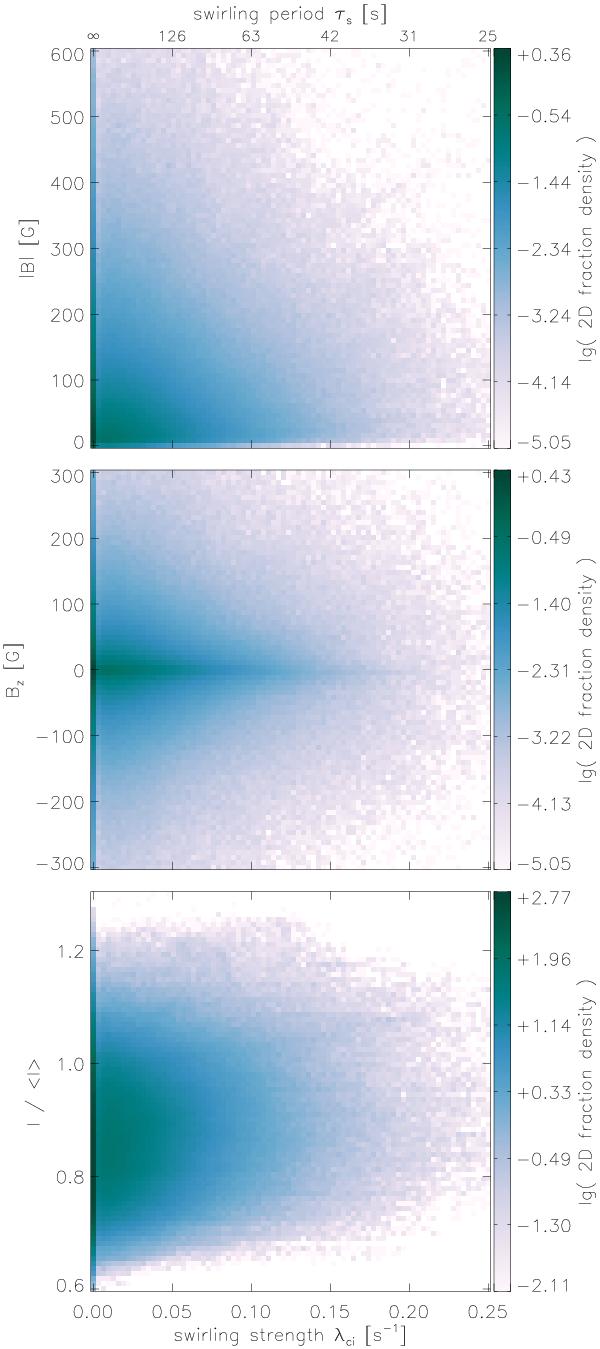
2D histograms of the swirling strength and various observables (top panel: total magnetic field strength, middle panel: vertical magnetic field component, bottom panel: emerging intensity normalized by the overall horizontal mean) for Run C. All downflow regions in a ± 25 km range about the average height of the optical surface are taken into account. Each histogram is normalized such that an integral gives the fraction of volume with properties in the integrated range.
Current usage metrics show cumulative count of Article Views (full-text article views including HTML views, PDF and ePub downloads, according to the available data) and Abstracts Views on Vision4Press platform.
Data correspond to usage on the plateform after 2015. The current usage metrics is available 48-96 hours after online publication and is updated daily on week days.
Initial download of the metrics may take a while.