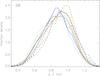
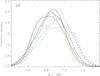
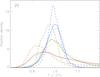
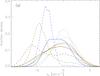
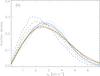
Fig. 4
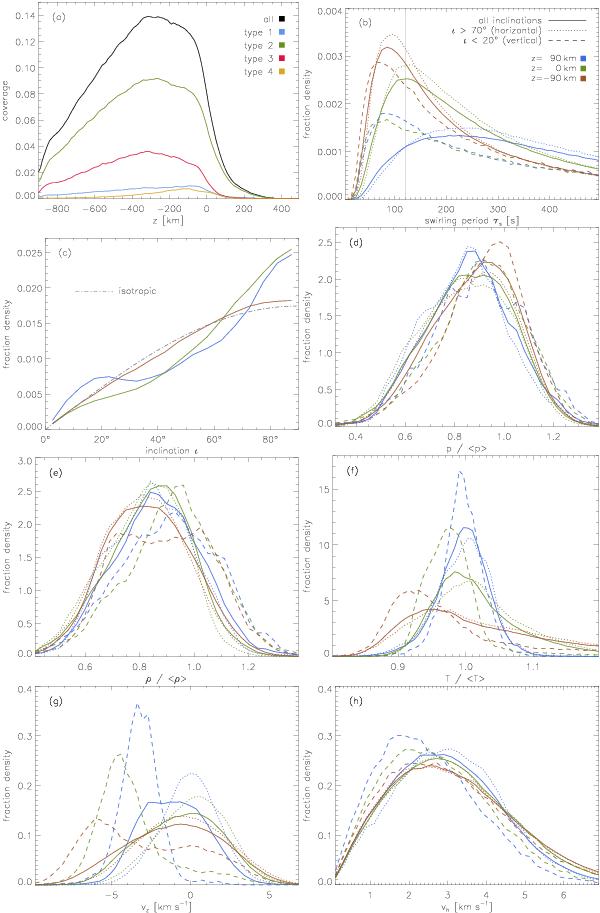
Vortex cell statistics for Run C. Except for panel a), different heights are represented by brown (z = −90 km), green (z = 0) and blue lines (z = 90 km). Except for panel b), only strong swirls with τs < 120 s are taken into account. The dashed and dotted lines represent the subset of vortices with vertical (ι < 20°) and horizontal (ι > 70°) orientation, respectively. The fraction densities plotted in panels b)−f) are normalized histograms, the normalization being such that the integral over all values of the respective abscissa variable is one. Angle brackets ⟨ ... ⟩ denote the horizontal mean of the respective variable in downflow regions (i.e., where vz < 0 at the respective height).
Current usage metrics show cumulative count of Article Views (full-text article views including HTML views, PDF and ePub downloads, according to the available data) and Abstracts Views on Vision4Press platform.
Data correspond to usage on the plateform after 2015. The current usage metrics is available 48-96 hours after online publication and is updated daily on week days.
Initial download of the metrics may take a while.